
Diplopia Charting
Diplopia chart is the record of separation of the diplopic or double images in the nine positions of gaze. It can be plotted charted in patients who cooperate and can appreciate the double vision and with incomitant or comitant deviation.
The method
The patient should be comfortable with his head erect and should preferably be still throughout the examination. The test is preferably carried out in a dark room. Red glass is put in front of one of the eyes (red in front of right, R for R, is a convention). It is desirable to use Armstrong goggles since these are shaped to fit the orbital margin and therefore patient would be looking only through the colored medium. The examiner holds the torch (vertical source of light) at around ½ m or 1 m (It is important to mention the distance on the chart). This source of light could be horizontal if the complaint is of vertical separation of images
The light is held directly in front of the patient at first.
If the patient sees a single image, the examiner must establish whether it is a fused image, if suppression is present or if one image is obscured, for example by the patient’s nose bridge. If there is no double vision in the primary position, the position in which double vision appears and is maximal is to be noted.
If the patient notes a double image, the relative position of these images is noted. The light is now carried to the right and then to the other 8 positions of gaze. In each gaze position the patient must be asked whether the images are parallel or tilted; if the torsion is present colored pencils can be given to an observant patient to show the separation in torsion. Also, in each gaze patient should be asked the amount of separation subjectively and its increase in a particular gaze.
Interpretation of a diplopia chart
To interpret the diplopia chart the most important questions are
- The position in which diplopia appears
- The position in which the separation of the image is the greatest
In the direction of the action of the paralyzed muscle, the double vision or the separation would be greatest because of the underaction of the muscle and overaction of the antagonist muscle and yoke muscle.
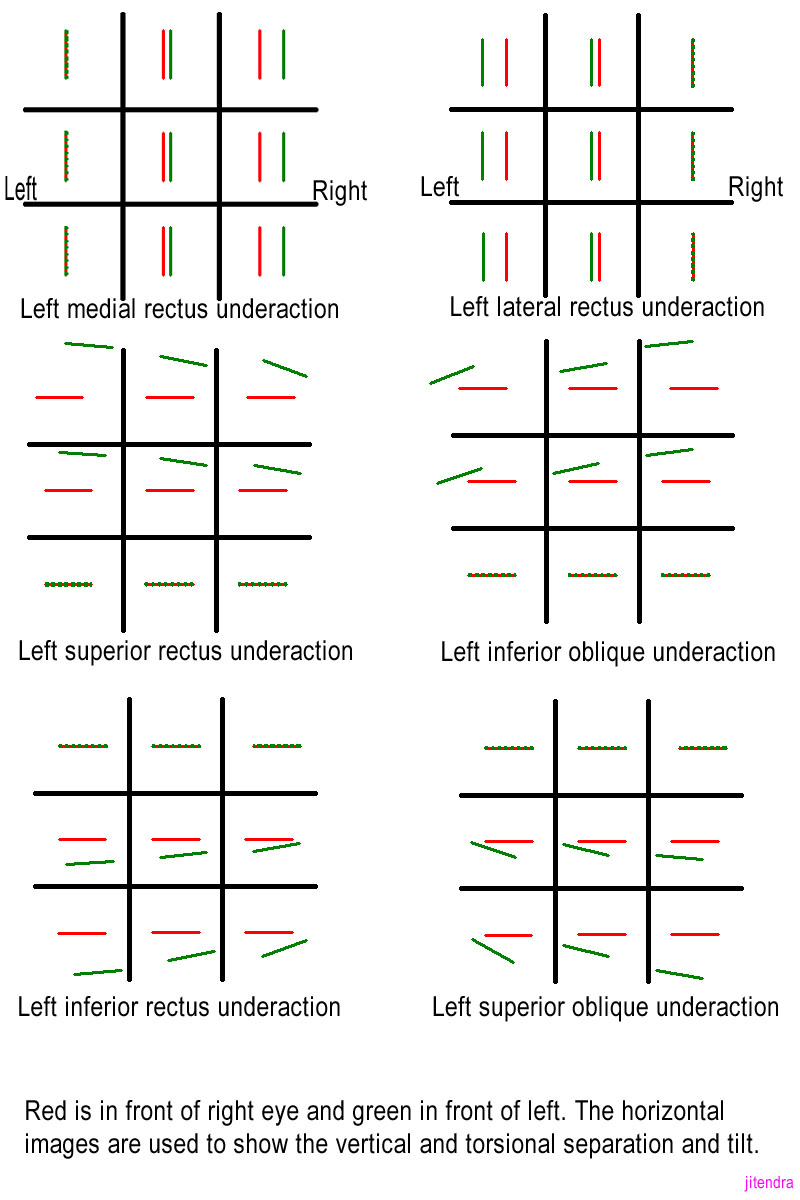
Therefore, in paralysis of the left lateral rectus muscle (Fig 1), the separation of images would be maximal in the left gaze or levoversion. This follows that if there is a horizontal increase in separation of images seen on the right side, the muscles which rotate the eye towards the right (that is right lateral rectus and left medial rectus) would be underacting or paralyzed. If the eye deviates inwards, it will project outwards the image of an object fixed by other eyes. Therefore, in the position of eyes in which the images are most widely separated, the distal image always belongs to the paralytic eye. With the help of color of the image the eye (to which the images belongs) could easily be found
If the images are vertically separated, where the separation increases on downgaze, one of the depressors are involved. If the separation increases on looking down and to the left, the left-hand depressors are involved (in case of paralytic strabismus) (left-hand depressors would be left inferior rectus and right superior oblique). If the image belonging to the left eye is the lower one, the left inferior rectus is involved. (Fig 1)
Importantly the images may also be tilted in vertical muscle paralysis and therefore torsion would also give valuable hint in coming to a conclusion. Therefore, if the left inferior rectus is involved, the eye would be intorted and the image seen would be extorted. The maximal torsional movement for this would be seen in the right gaze downwards. (Fig 1)
Diplopia chart (precautions)
- Head must be kept straight during the examination
- The goggles must be well-fitting
- The light should be kept upright (or horizontal in case of vertical or torsional diplopia) and held at a consistent distance
- The patient should be asked about the tilting of images
- The light should be visible to both the eyes
- Never interpret the diplopia chart in isolation, clinical examination and Hess chart should be used in conjunction to come to a conclusion
Diplopia chart (recording on paper)
- While recording the diplopia on paper the right and left is the patient’s right and left and not the examiner’s (Fig 1)
- Always note the distance at which the diplopia charting was done
- Note the distance of separation of the images in each position as told by the patient subjectively
- Tilting of the image is drawn as the patient describes
- Although the charting could be drawn from the examiner’s viewpoint too, it is imperative to note it in the chart.
Diplopia chart (value)
- It only gives a picture of the patient’s double vision.
- Maximal separation of images may give an idea about the paralyzed muscle
- Not very useful in recording paresis
- Not much helpful in diagnosis in multiple muscle pathologies
It is useful particularly in
- Torsional diplopia (especially in bilateral symmetrical superior oblique palsies)
- Patients who is bedridden
- The patient who is otherwise incapacitated
- Unable to plot Hess chart
- Unable to plot Binocular field of fixation
- Diplopia chart should be interpreted with clinical findings and other investigation like the binocular field of fixation, Hess chart, etc.
Hess Charting
It aids in the diagnosis of ocular motility defects. It measures the deviation and the amount of underaction and overaction of muscles. It is a repeatable and reliable record of the condition and is, therefore, a good way to show improvement or deterioration of the condition.
Hess Chart (principle)
The principle is the foveal projection. The chart is plotted based on Hering’s and Sherrington’s law of innervation. The dissociation of two eyes is by the means of colors or mirrors (as in Less screen). Now foster torches are used for projection of the target.
There is an illuminated Hess screen on which each target can be lit up in turn and its position indicated by the patient using a linear green light. Less screen used the principle of the mirror.
Hess Chart (method)
The test is performed with each eye fixating in turn. It is done at 50 cms. The patient wears complimentary red and green glasses. The left eye is tested first followed by right eye. The read glasses are placed on the right eye first (Red for right, R for R)
The chart has electronically operated board
with small red lights. The red lights can be illuminated as needed separately. The foster torch is of green light and is in the patient’s hand. The patient is asked to place the green light in each of the points on the red light as illuminated on the chart. Next, the goggles are changed and the left eye has red goggles and the eye to be tested is the right eye.
Hess Chart (recording)
The recording, as mentioned above, is done first with the red glass over the red-eye and repeated with red over the left eye. The eye that has the red glass is the fixing eye. The eye with the green glass is the eye being tested. The required points are joined to form an inner and outer square.
Hess Chart (precautions)
The patient’s head must remain straight throughout the procedure/ test. Occasionally, it becomes necessary to hold the head in the correct position. The foveae must have a common visual direction
Hess Chart (indications)
Any patient who complains of double vision should be tested on the Hess chart. Specific indications are
- All patients of incomitant strabismus with normal retinal correspondence (NRC).
- Patients of esophoria or intermittent Esotropia of divergence weakness type to rule out 6th nerve palsy.
- To provide a baseline in conditions likely to develop defective ocular movements like in thyroid-related orbitopathy.
Hess Chart (interpretation)
The interpretation of Hess chart is done on basically three broad parts: Position, Size and Measurement, and Shape
- Hess Chart (position)
The basic principle of Hess chart if foveal projection, therefore, the higher field belongs to the higher eye. This is the opposite of diplopia charting where the higher image is of the lower eye. The position of the central dot indicates whether the deviation is in the primary position or not. The position of the central dot is to be seen both fixing the right eye and fixing the left eye.
- Hess Chart (size)
The variation in the size of the Hess chart of each eye is due to the Hering’s law. The small field belongs to the eye with the primary limitation of movement. Underaction can be seen with the inward movement of the dots and therefore the whole curve. Maximum displacement occurs in the direction of the affected muscle if the patient has presented early before the spread of comitance.
Overaction can be seen by noting the outward displacement of the dots. Maximum displacement occurs in the direction of the main action of the overacting contralateral synergist in the larger field.
Overaction can be seen by noting the outward displacement of the dots. The maximum displacement of the dots occurs in the direction of the main action of the overacting contralateral synergist in the larger field.
If the inward and outward displacement is less marked, secondary underactions and overactions are present as a result of the development of muscle sequel. The outer field should be examined for small underactions and overactions which may not be apparent in the inner field.
A narrow field restricted in opposing directions of movement denotes a mechanical restriction of ocular movement. Equal sized field denote either symmetrical limitation of movement in both eyes or a non-paralytic strabismus
- Hess Chart (Shape and measurements)
Each small square on the grid subtends 50 at the working distance of 50 cm, therefore the amount of deviation can be calculated. In the primary position, the amount could be calculated by fixing either eye by the displacement of the pointer from the center dots. The amount of underaction and overaction can be calculated in the various positions and hence the amount of excursions can also be calculated. Cyclotropia can also be measured in degrees by the torsion placement of the chart. A linear pointer can also be used to calculate the same.
Hess Chart (value)
It can be used to assess the progress of the disorder. It helps in finding out whether the underaction in a particular gaze is improving or not. This could help the ophthalmologist in planning the treatment and evaluate the results. However, a Hess chart should not be viewed in isolation; the importance of a good clinical ocular motility examination cannot be understated. Apart from the clinical examination, diplopia charting and binocular visual field testing also help in the better management of the patient.
Few clinical examples (Figure 2)
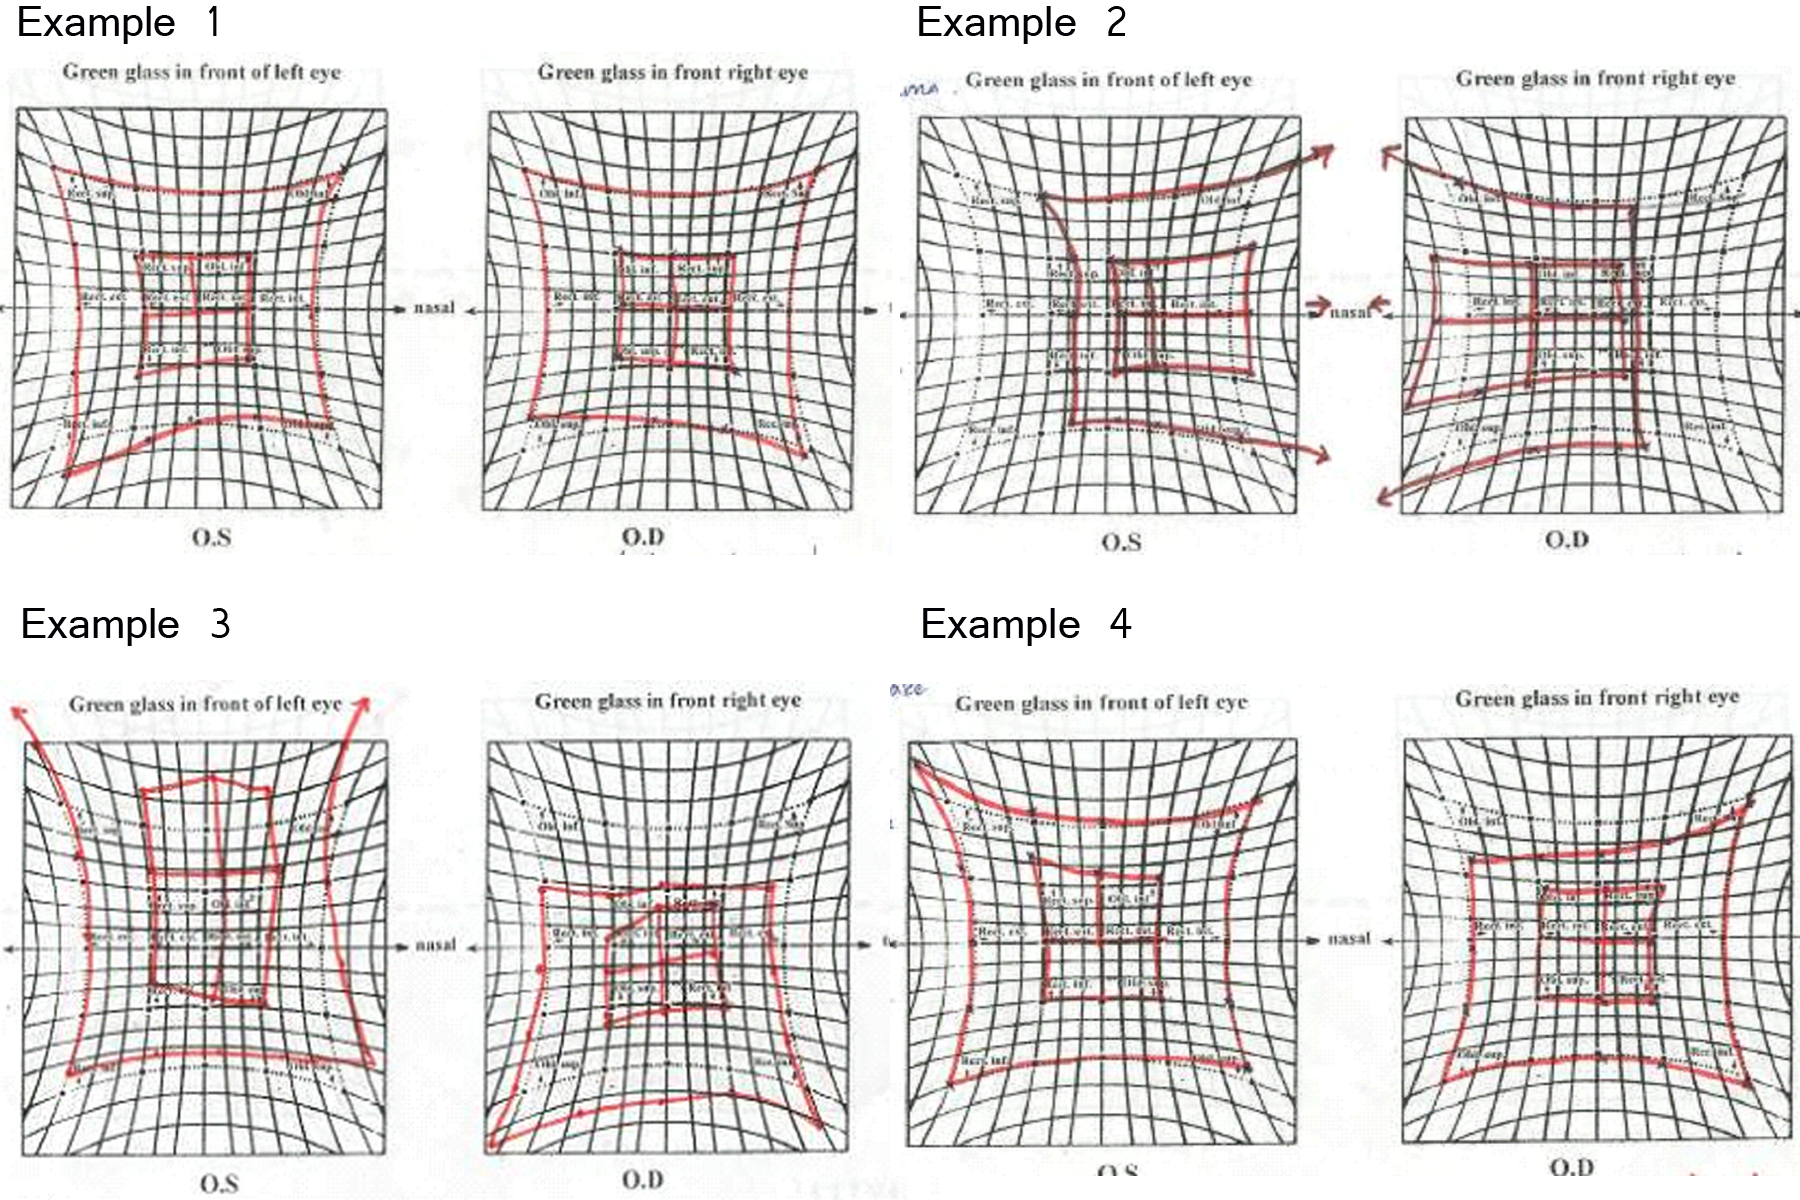
Example 1
Bilateral Superior oblique palsy
Both the charts are to be seen carefully. It is obvious that both the charts show superior oblique underaction. There is a contralateral inferior rectus overaction. Both the fields are extorted. The midline is shifted in both eyes indicating diplopia in primary position (torsional). The right eye shows a slightly greater underaction of superior oblique.
Both the charts appear extorted. This was a patient of traumatic bilateral superior oblique palsy.
Example 2
Both the eyes show small fields. Overaction is seen in both the eyes on the nasal side. Inner field is closer to outer one so likely to be fresh palsy then an old/ recovered one. Midline is shifted nasally therefore the eyes are also shifted nasally. The patient had a bilateral lateral rectus palsy of recent onset.
Example 3
The right eye field in this example is smaller and the left eye field is larger. The outer upper line is closer to the inner line; the lower one is at a distance. The superior function is lost, which is the inferior oblique and the superior rectus is underacting. The central point is moved downwards so diplopia is there in primary position
This was a patient of the entrapment of the inferior rectus.
Example 4
The field of the right eye is smaller compared to the left eye. There is an obvious underaction of the inferior oblique. Superior rectus of the left eye shows overaction. This was a patient of Right eye inferior oblique palsy. It is important to distinguish this from a Brown’s syndrome which may be acquired and may show a similar picture. However, it could be easily distinguished as the inner and outer fields would be closer and extremely asymmetric. Clinically, it can be distinguished easily with Guyton’s exaggerated force duction test.